
 As part of an overall optimization and takeback of a commercial mall in Virginia, EES engineers, step by step, enhanced systems to make a chilled-water plant more efficient. This article is about optimizing the chilled water pumping and pressure loops. In future articles, we’ll dig into condenser water loops and the overall plant optimization.
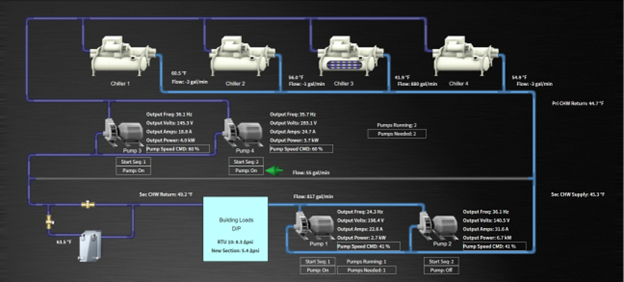
The plant had four (4) chillers, two (2) primary chilled water pumps, and two (2) secondary water pumps. There was a cross-flow pipe to handle any imbalance between the primary and secondary loops.
When we started, the client’s engineer was operating all 4 pumps at 100%. The cross-flow was not measured. We added a bi-directional flow meter and we were not entirely surprised by the amount of flow in the cross pipe. It was on the order of 1,000 gallons-per-minute. Pure waste. Primary and secondary imbalance. Nothing useful came from that flow.
Before we started tuning, we measured the kW of the 4 pumps. Each of the two secondary pumps were running at about 30kW. Each of the primary pumps were running at about 18kW. The total chilled water pumping power was 96 kW.
After setting the control system to run secondary pump speed based on end-of-line differential pressure, we found that one of the two pumps could be turned off (it was in hand because the VFD failed). The secondary pumping kW went from 60 kW to 2 kW.
Once we set up the primary pumping to minimize the crossflow, the primary pumps went from a combined 36 kW to 4 kW each, or 8 kW. The cross flow went from 900 GPM to around 5.
So, the total pumping power went from 96 kW to 10 kW with no loss of cooling effectiveness. Additional savings occur nightly when the roof top units (RTUs) go unoccupied and draw less water. This has the effect of lowering the pumping need even further.
Here is one of the two primary pump power curves, before, during, and after the tuning. It is x2.
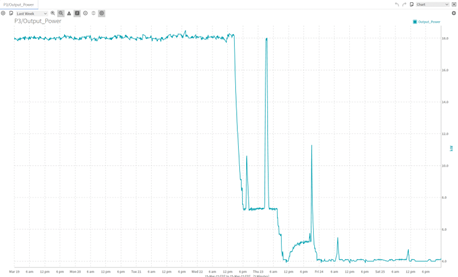
Here is one of the two secondary pump power curves, before, during, and after the tuning. Also note that we went from two pumps to one.
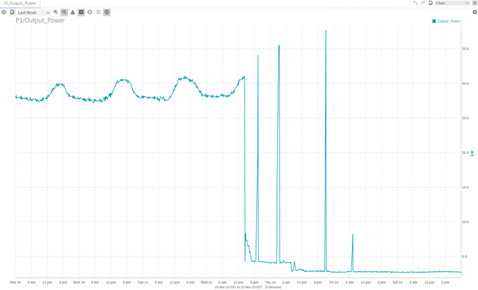
The spikes are from adjusting the tuning and observing the results. Also, the building network is CCN (Carrier Comfort Network, a proprietary precursor to BACnet) and is not perfectly reliable. In situations where we lose contact with the RTU that has the differential pressure, we assume the worst, forego savings, and pump like the pressure is zero, just to be safe.
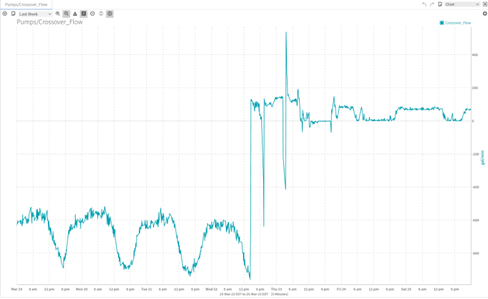
Here is the cross flow. Remember, optimal is zero, meaning that the flow through the chillers exactly matches the flow to the building. The sign is arbitrary. There is not negative flow, just flow in the reverse direction.
To put the savings of this tuning into dollars, assuming a blended rate (between peak and off-peak rates) of $0.18 per kWh, one day’s cost to operate the plant went from $414.72 to $43.20, yielding an average DAILY savings of $371.52. Wow!! That equates to $11,145.60 per month!
The bottom line is: let EES optimize your chilled water flow to save quite a bit of money and, subsequently, maintenance on your pumping plant. Here’s proven results.
Reach out to learn how we could save you money with your pumping plant.